MERLINN EPD DASHBOARD+BD-CLEAR VIEW OF ENGLAND PRESCRIPTION DATA

Product Description
Triton BIT Solutions Ltd
-
Country/Region:United Kingdom
-
On CPHI since:2025
-
Employees:1 - 24
Company types
Primary activities
Categories
Specifications
Triton BIT Solutions Ltd
-
Country/Region:United Kingdom
-
On CPHI since:2025
-
Employees:1 - 24
Company types
Primary activities
More Products from Triton BIT Solutions Ltd (2)
-

Product MERLINN GROW- KEY SERVICES TO MAKE INVESTMENT
MERLINN GROW IN THE UK
Triton not only provides an advanced analysis tool, but also delivers optional Presentation reports covering detailed analysis of molecules and business process. -

Product PHARMASENSE SALES FORCE EXCELLENCE
PHARMA SENSE MODULES
• Main View: Measure overall team performance at a glance. • Sales Dashboard Track pharma-specific KPIs • Geo Dashboard: Analyze data geographically. • Market Dashboard: Market Analysis. • Call & Detail Analysis: Evaluate call activity and detailing p...
Triton BIT Solutions Ltd resources (2)
-
News MERLINN TODAY NEWSLETTER-Merlinn is the missing link between data and decision — a complementary, easy-to-use tool that transforms NHS EPD data into clear insights.
Why You Should Use Merlinn
Merlinn is the missing link between data and decision — an easy-to-use, complementary tool that turns NHS EPD data into strategic insight.
With flexible usage options and same-day project delivery, it provides quick and measurable results.
Merlinn makes analytics interactive and enjoyable, helping users test ideas, find opportunities, and innovate confidently.
It offers dedicated panels for different needs:
Market Access, Business Development, Investor, and Grow in UK.
-
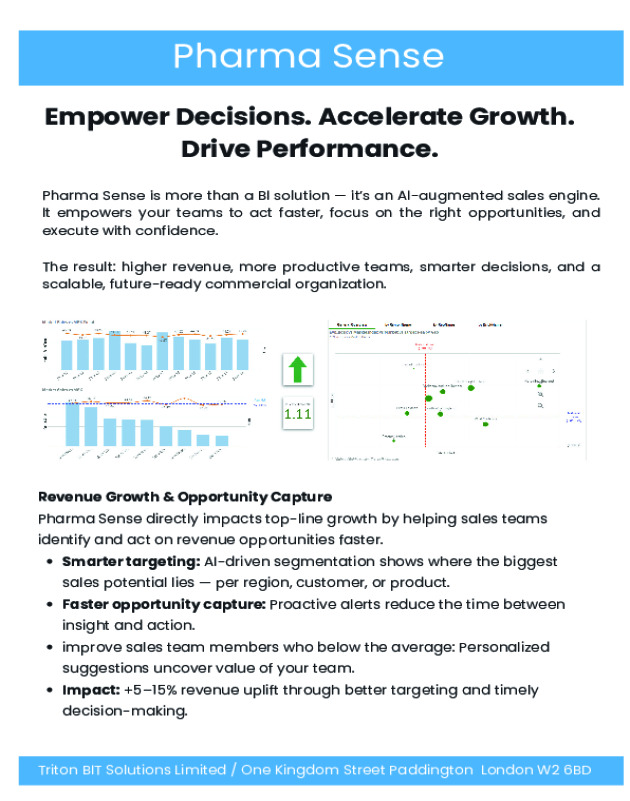
Brochure PharmaSense: Empower Decisions. Accelerate Growth. Drive Performance.
Pharma Sense is more than a BI solution — it’s an AI-augmented sales engine.It empowers your teams to act faster, focus on the right opportunities, andexecute with confidence.The result: higher revenue, more productive teams, smarter decisions, and ascalable, future-ready commercial organization